USD/JPY Fibonacci analysis: close to test a strong support
Read the article on FBS website
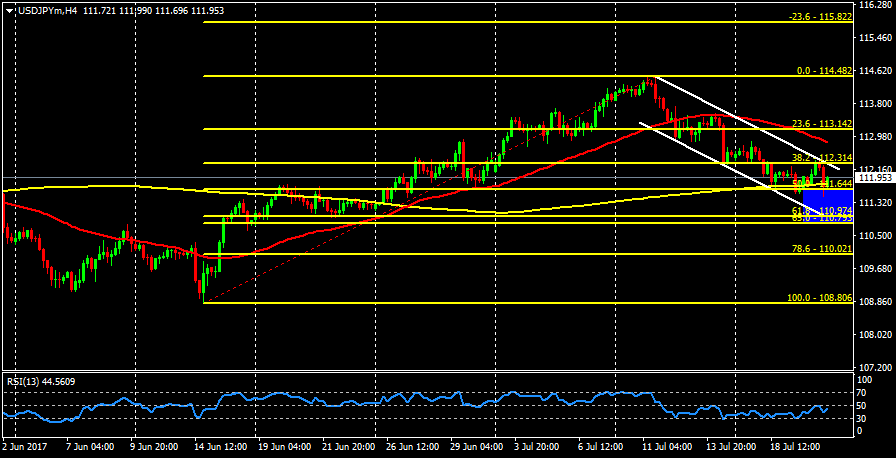
USD/JPY has been following a bearish channel since last week and it looks like that the path is driving towards the Fibonacci retracement zone of 50% and 65% at 111.64 and 110.79 respectively. USD weakness is fueling the current move and a consolidation could happen over there. Also because the 200 SMA is trying to provide dynamic support. If that happens, the pair will run towards -23.6% Fibo level at 115.82.
RSI indicator is still in the negative territory, but it’s pointing to the upside.