The Bollinger Bands (BB) is a classic trend indicator developed by John Bollinger. His book Bollinger on Bollinger Bands contains a detailed description of how to use it on its own, as well as with other tools of technical analysis. BB is very popular among traders all over the world. It is a type of statistical chart characterizing the prices and volatility over time of a financial instrument or commodity, using a formulaic method.
About Bollinger Bands
The indicator consists of 3 lines – a middle band and two outer ones. The middle band is a simple moving average, usually with a period of 20. The outer bands are usually set 2 standard deviations above and below the middle band.
Bollinger Bands are similar to the Envelopes indicator. The difference is that the borders of Envelopes are situated above and below the moving average at a fixed distance in %, while the borders of Bollinger Bands are calculated on the basis of the constantly changing standard deviation.
How to implement
The Bollinger Bands indicator is part of the default settings of MetaTrader. You can add it to your chart by clicking Insert – Indicators – Trend and then choosing Bollinger Bands.
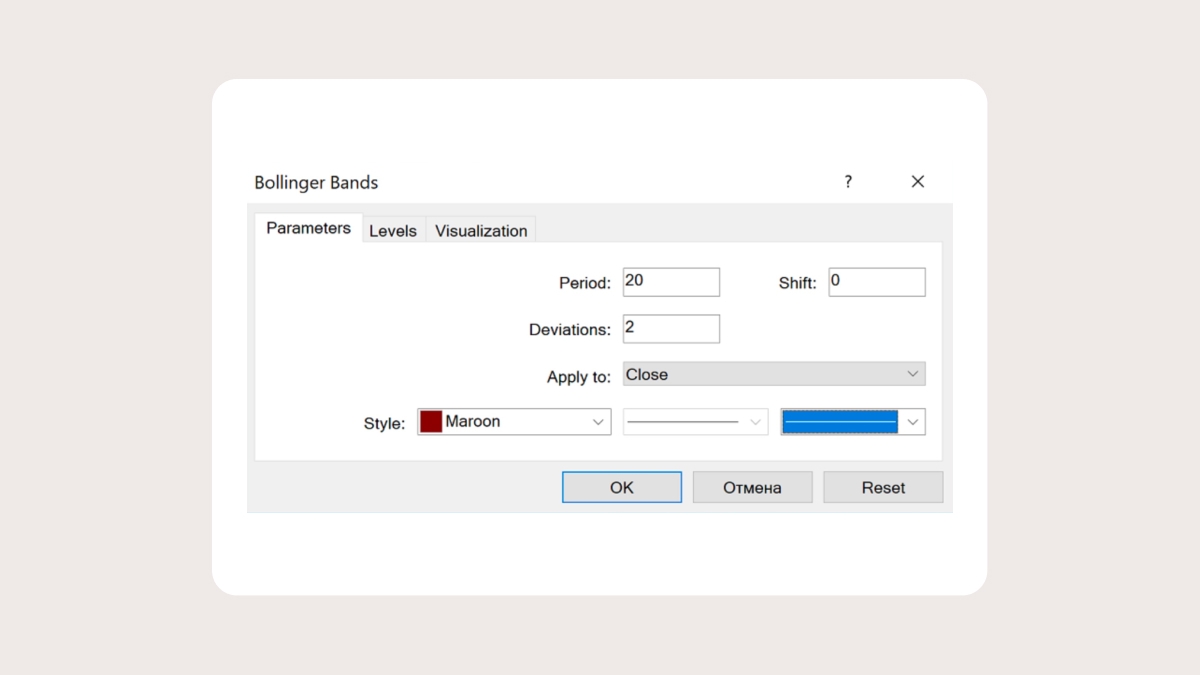
By default, MT will offer you 20 as a period and 2 for deviation. You can change these parameters if you want to. It’s recommended that you use periods from 13 to 24, and the deviation should be in the range between 2 and 5. For example, it’s possible to use 50 and 2.1 for longer timeframes, and 10 and 1.9 for shorter timeframes. Note that the smaller the period, the more trading opportunities are offered by the indicator. The number of false signals, however, will be greater as well. At the same time, the indicator becomes less sensitive with larger timeframes. This approach is not suitable for markets with low volatility.
The wise thing to do is adjust the Bollinger Bands to the asset you’re trading. If the price crosses the upper or the lower band too often, you need to increase the period. If the price rarely reaches the outer bands, it makes sense to reduce the period.
The BB can be used on all timeframes, although the indicator is more common for the intraday one. You can also apply the Bollinger Bands to an oscillator that is drawn in a separate window below the price chart. For example, you can apply BB onto an RSI by selecting "Previous Indicator's Data" or "First Indicator's Data" in the Bollinger Bands' "Apply to" drop-down menu.
How to use Bollinger Bands to trade Forex
The assumption is that the price is between the outer Bollinger Bands 95% of the time, and only 5% of the time outside of them.
Bollinger Bands help to determine how big the deviation from the average price of a currency pair is.
The middle line may be used as a level of support/resistance, and the outer borders can act as profit targets. There are also strategies that imply trading reversals from the outer bands.
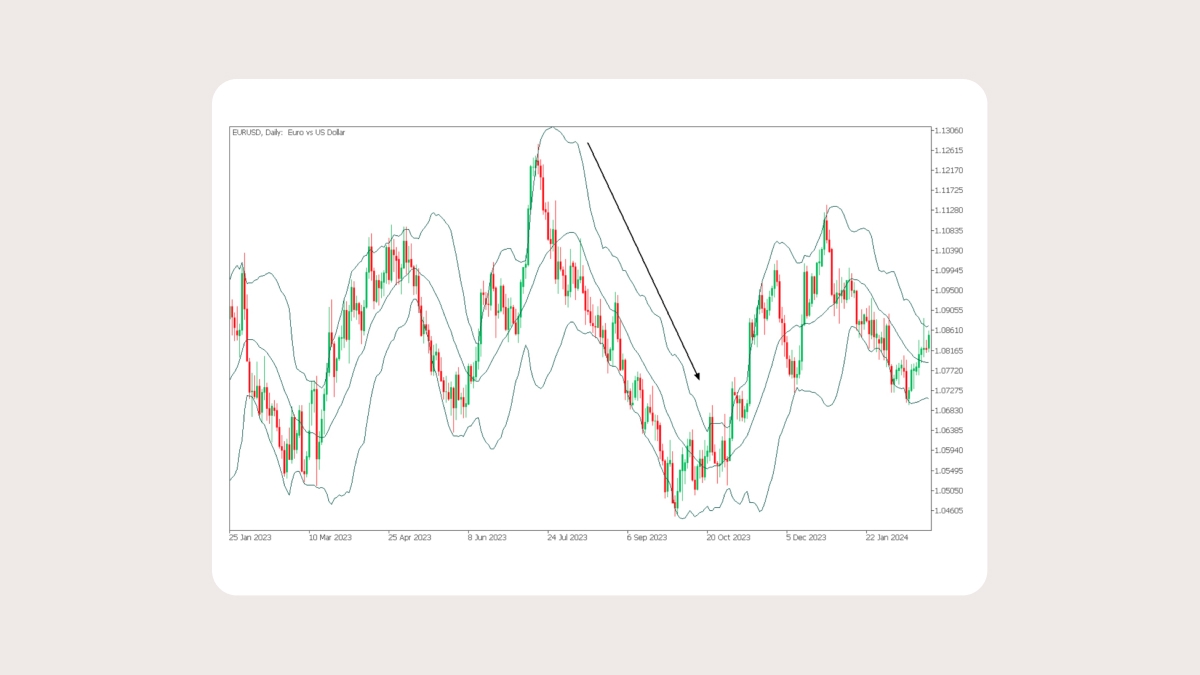
The slope of your BB and the position of the price relative to the middle band enable you to judge the direction of the current trend. If the Bollinger Bands have an upward bias and the price tends to be above the middle line, it’s an uptrend.
If the Band’s bias is negative and the price spends the majority of the time below the middle line, it’s a downtrend.
Bollinger Bands as an indicator of volatility
The key feature of BB is that the indicator's lines react to the market’s volatility: the Bands widen when the volatility is high (for example, when an important news release is out) and narrow when it declines.
By doing this, the Bollinger Bands indicate the moment when the market switches from calm to active. When the Bands come closer to each other, that tells us we are trading in a non-volatile market, and that a volatile period is looming on the horizon. A breakout of the recent range is probable.
The chart below shows an example of this: the Bands compress, and then the price breaks above the resistance, making big moves to the upside.
In a trending market, if the Bands widen, this points to the continuation of a trend. If they become narrow, this may signal that the trend is weakening and may soon reverse.
Trading a move beyond the outer borders
Usually, when the price goes beyond the outer Bollinger Band, that signals the start or continuation of a trend. If the price touches and breaks through the upper BB, it’s an uptrend. If the price keeps attacking the lower BB, it’s a downtrend.
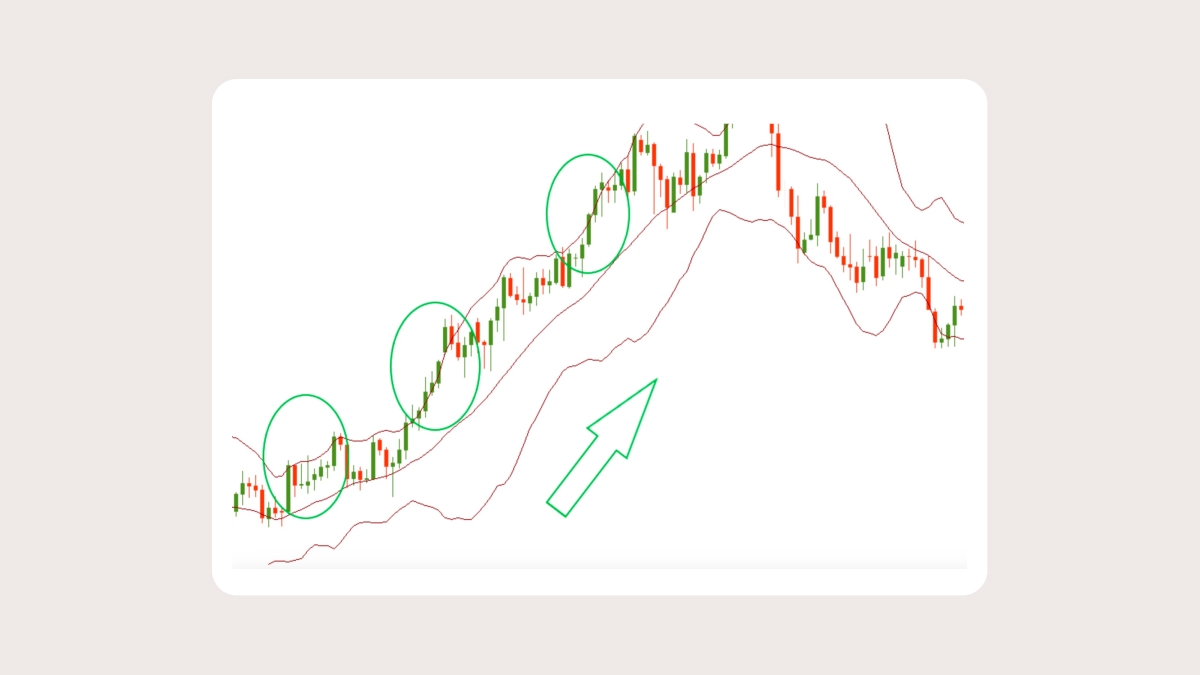
Most often, the price lasts no more than 4 candlesticks beyond an outer Bollinger Band before a correction takes place. Note that when the market is trending, the price can spend a great deal of time in the area/at one of the outer Bands.
Trading a reversal from the outer bands
The Bollinger Bands can also act as an oscillator. When the price reaches the upper Band, the asset is trading at a relatively high price and is considered overbought. When a price approaches the lower Band, the asset is trading at a relatively low price and is considered oversold. It’s common knowledge that overbought and oversold conditions lead to a correction.
However, as we have learned from the previous passage, if the trend is strong, the price can stay at the upper/lower Bollinger Band, or even beyond it, without retracement, for a prolonged period of time. If you want to trade on the pullback from the upper or lower Bollinger Band, you will need a confirmation of the market’s reversal from candlestick patterns, or another indicator.
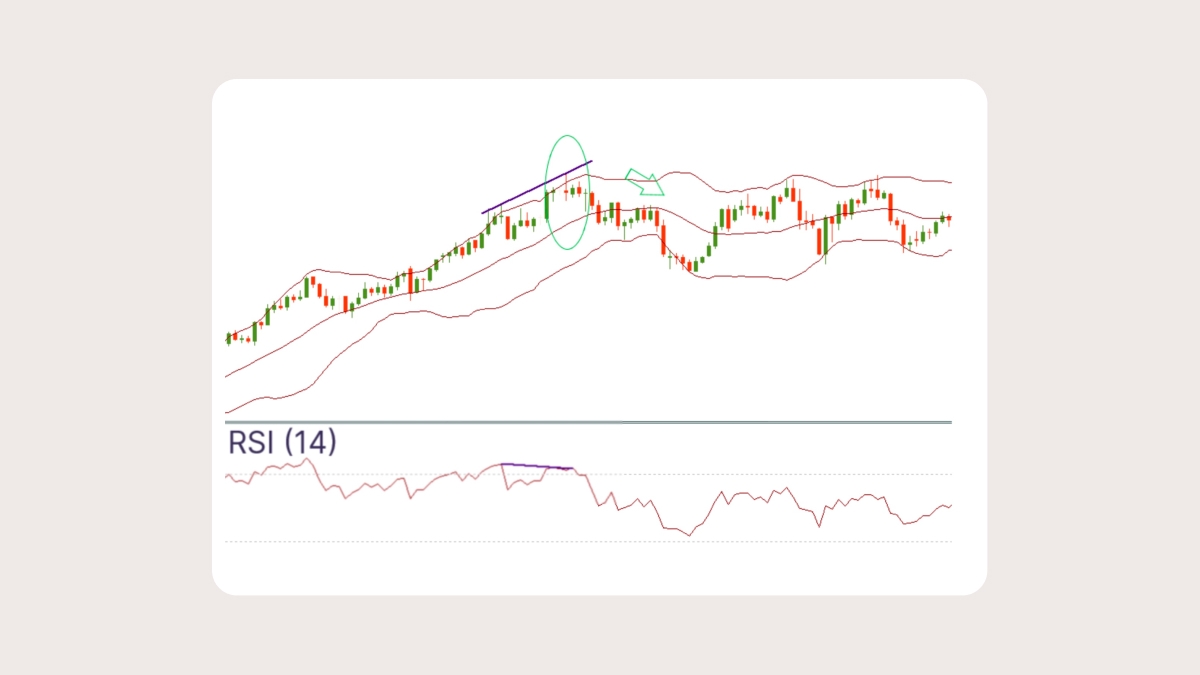
The chart above shows that the reversal down from the upper BB is confirmed by a bearish candlestick pattern (evening star) and a bearish divergence between the RSI and the price chart.
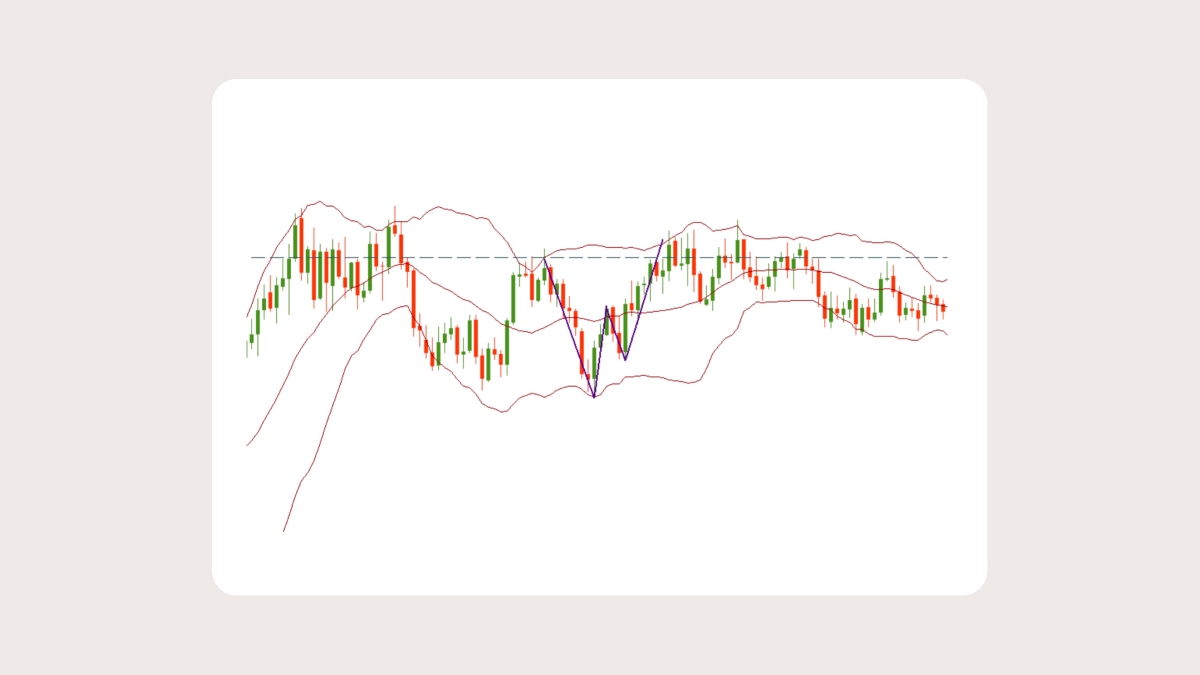
There are examples of a particular type of price action near the outer Bollinger Bands. A W-bottom forms in a downtrend and involves two reaction lows. The second low should be lower than the first one and hold above the lower Band. An M-top is the opposite of a W-bottom. In its most basic form, it is similar to a double top. However, the reaction highs are not always equal. The first high can be higher or lower than the second one. The use of Bollinger Bands for 'M' and 'W' signals looks to provide earlier indications than those produced by the conventional 'M' and 'W' chart patterns.
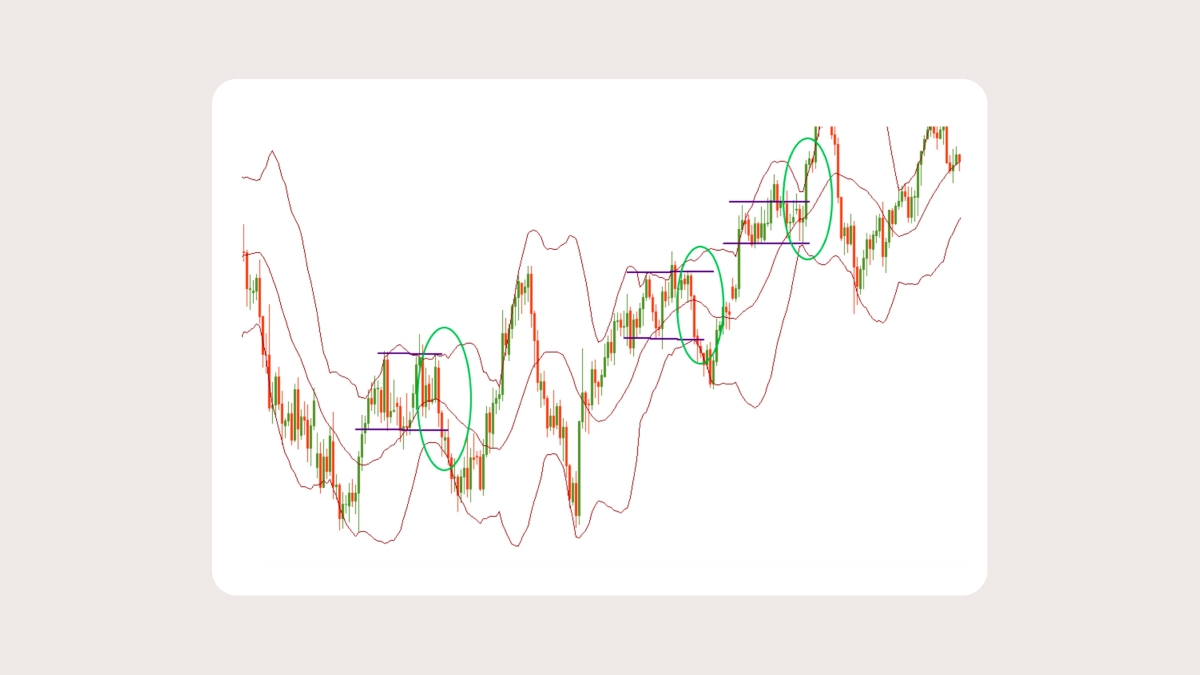
Trading a crossing of and a pullback from the middle line
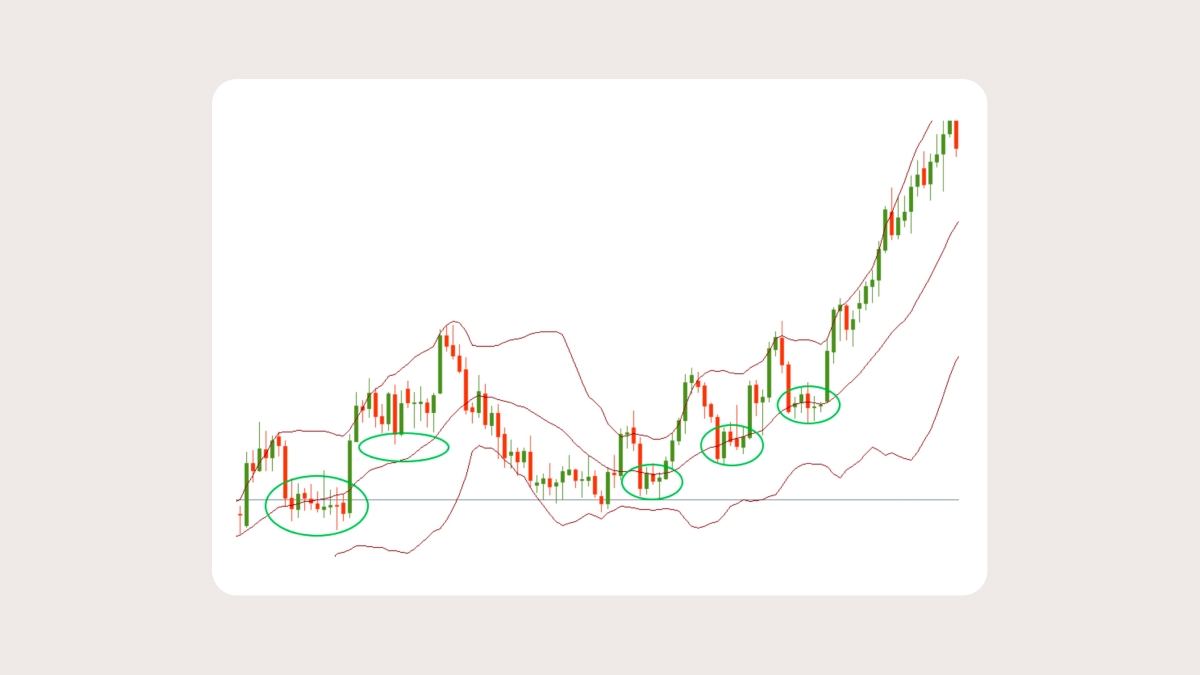
The middle line acts as a dynamic support/resistance. If the price crosses the middle BB, it signals a trend change. Don’t forget to look for confirmations in such cases.
Note that the price often tests levels beyond the middle line before reversing. These false breakouts may confuse traders.
If the price deflects off the lower Band and crosses the middle line to the upside, the upper Band will be the upper price target. In a strong uptrend, prices usually fluctuate between the upper Band and the middle Band. As a result, in a strong uptrend, consider looking for buying opportunities at the middle Band. If the uptrend is not so strong, corrections may be deeper and reach the lower BB. In a strong downtrend, look for selling opportunities at the middle BB. If the downtrend is not so strong, retracements may take the price up to the upper BB.
Summary
The Bollinger Bands indicator is a very useful technical tool that can form a solid basis for a very good trading system. It provides dynamic support and resistance levels and visualizes the level of volatility. Take your time to master this tool!