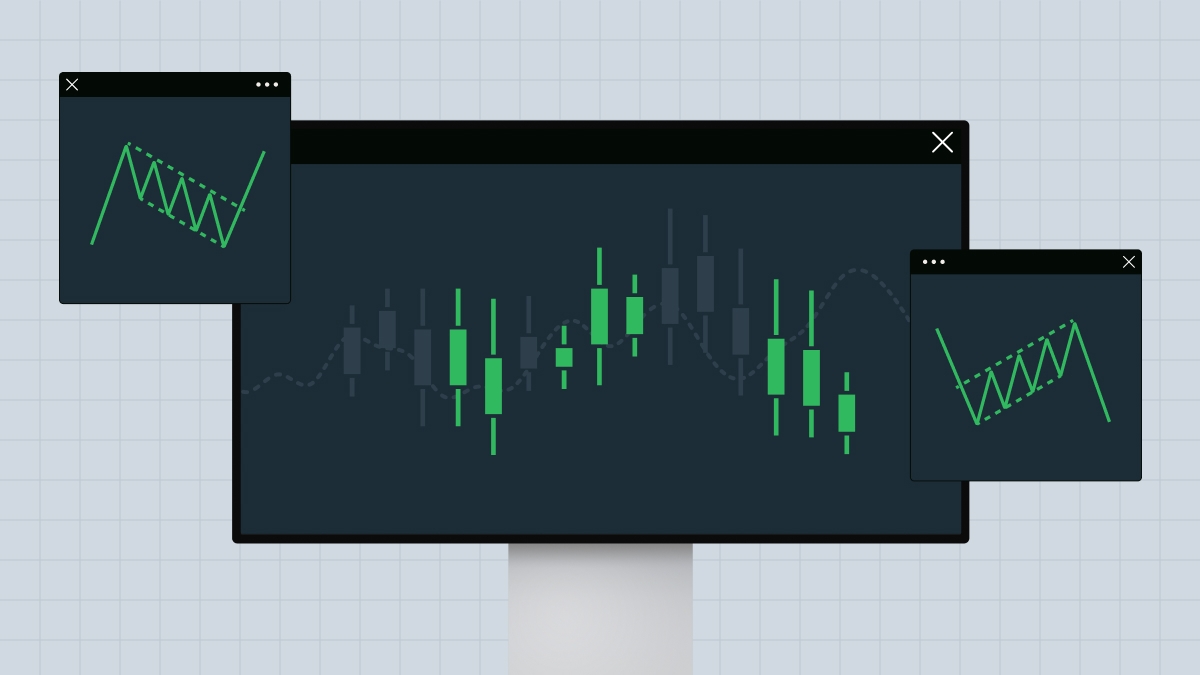
Flag patterns are integral to technical analysis and are widely used by traders because of their reliability in predicting probable movements. These figures on price charts are the main tools for both beginners and experienced market participants. Understanding flag patterns, their types, characteristics, and consequences, is important for developing an informed trading strategy.
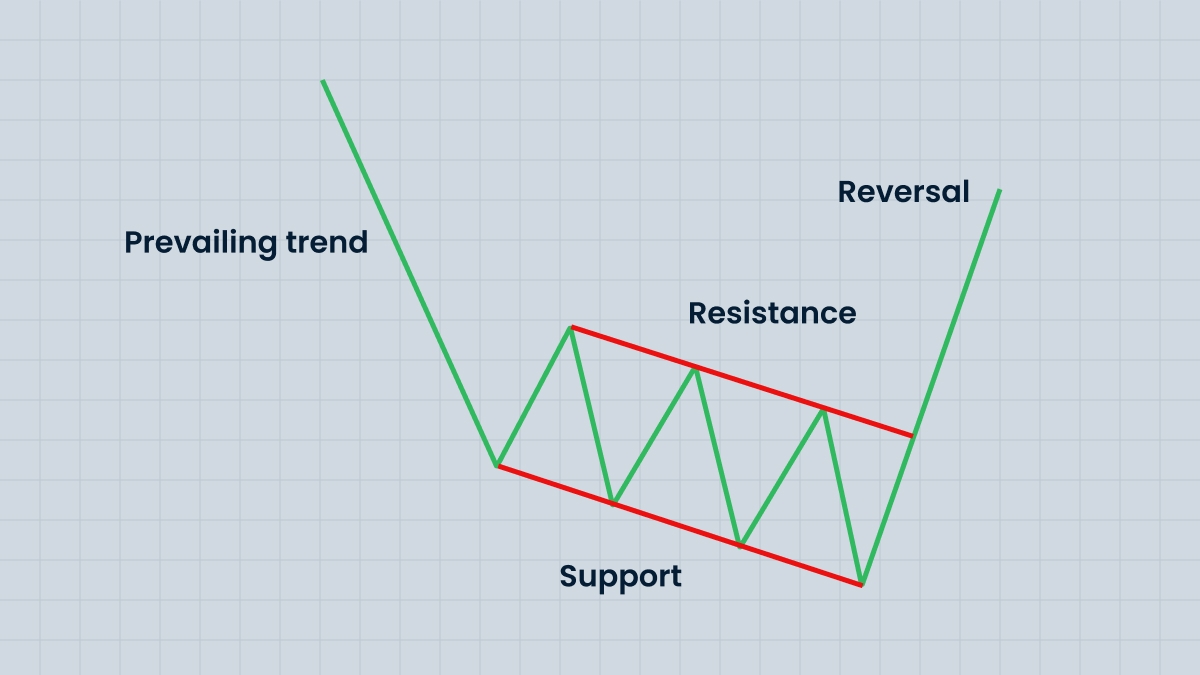
In the simplest terms, a flag pattern forms when the market consolidates following a sharp movement in price. This usually gives way to the formation of either a rectangle or a parallelogram in the chart. Such consolidation is often considered a minor halt during which prices move in narrow boundaries until the initial trend either continues or reverses. Flag patterns generally come as bullish and bearish, each one showing certain market sentiment and possibilities for further trade.
Bullish flag pattern
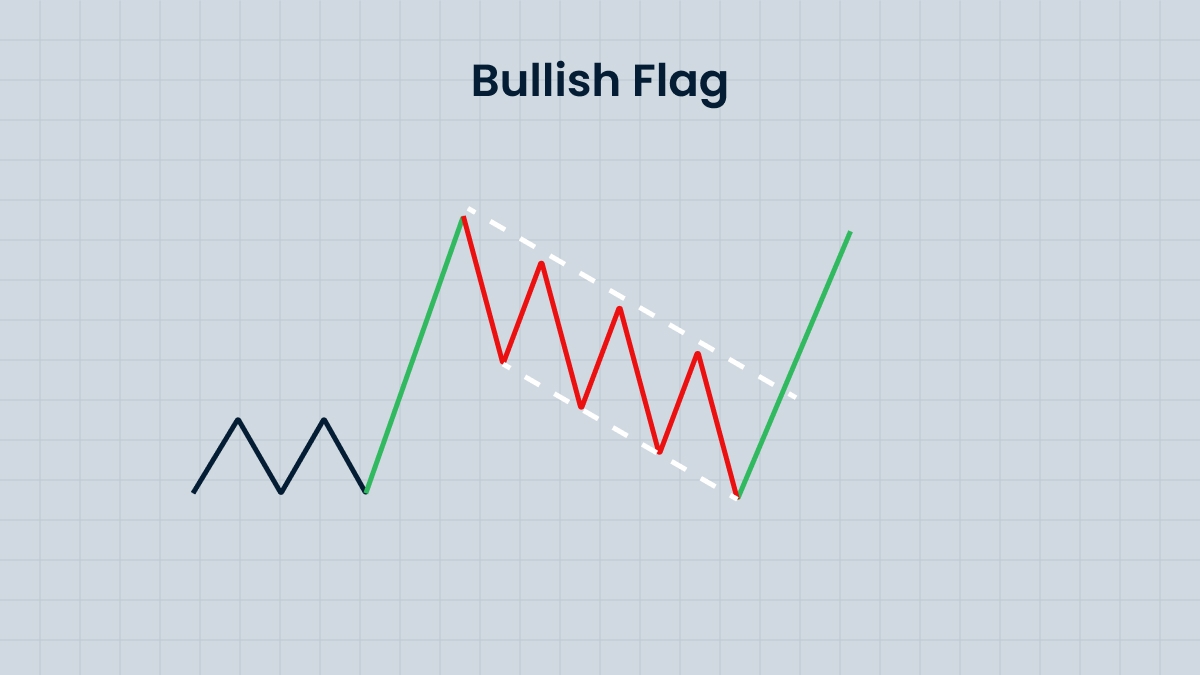
The bullish flag pattern usually appears after a strong upward price movement. It begins with a steep rise called a "pole", followed by a consolidation phase when prices decline slightly or move horizontally, forming a "flag". This temporary pullback often reflects traders taking profits after the initial surge. However, the underlying bullish sentiment is still strong, so once this consolidation ends, prices are liable to surge upwards, continuing the previous trend. Traders often look for a breakout above the upper limit of the flag as confirmation to open long positions.
For example, the stock may have jumped up significantly as a result of good earnings reports. After moving up, the stock may enter into a very narrow range — a flag pattern. A break above the range, usually on high trading volumes, will signal renewed buying interest and further upward momentum. Traders often use very specific entry points and stop-loss levels beneath the lower limit of the flag to manage risks.
Bearish flag pattern
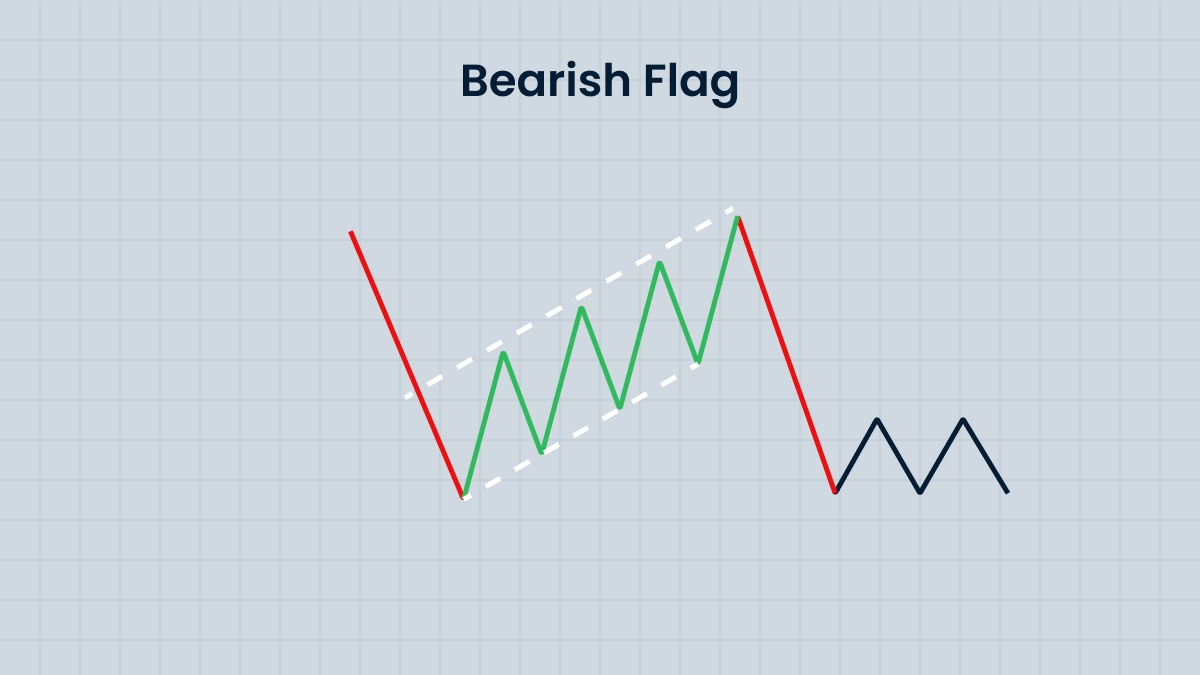
Conversely, the bearish flag pattern appears in a downtrend. It starts with a sharp drop in prices, forming a pole; followed by a consolidation with the prices moving upward or horizontally, forming a flag. What this pattern means is a temporary termination of the downtrend, which is often explained by the closing of short positions or speculative purchases. Once the consolidation is complete, prices often break through the lower boundary of the flag and continue the downtrend.
As an example of this, during a bear market influenced by negative macroeconomic data, a steep fall in prices can be followed by a gradual recovery or a sideways movement at the same level — a bear flag. A further break below the lower boundary of the flag normally confirms continuation of the downtrend, thus opening short positions. Accurate volume analysis may further raise the possibility of a breakout since such movements are usually accompanied by increased selling pressure.
Already know how to trade? Time to put your skills into action!