
On the daily chart of USD/JPY, there is a battle between bulls and bears to reach an important level at 88.6% of XC wave of the “Shark” pattern.

On the daily chart of USD/JPY, there is a battle between bulls and bears to reach an important level at 88.6% of XC wave of the “Shark” pattern.
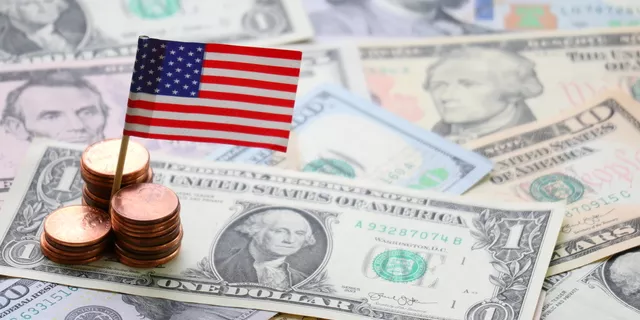
Traders and investors all over the world are highly anticipating the Federal Open Market Committee (FOMC) statement and the Federal funds rate announcement today at 21:00 MT time…
On the daily chart, GBP/USD pulled back after 88.6% target of the “Bat”. Bulls managed to defend 1.3050-1.3065 and play the Inside bar.

USD/CHF reached 0.9630 (50% of the medium-term rising wave), although the diagonal resistance in form of the upper border of the downtrend channel is a more serious obstacle.

The meeting of the Federal Reserve will be the main event of the day on Wednesday…
Pullbacks towards 23.6%, 38.2%, and 50% of the wave 4-5 can be used for selling with 161.8% target of AB=CD.

Let’s go through the main Forex topics that will offer you profit opportunities.

On the daily chart, AUD/USD stayed above the support at 0.7105 (78.6% of the long-term rising wave).

On the daily chart, bulls managed to lead NZD/USD outside of the downtrend channel. They are ready to trigger the “Shark” with 88.6% and 113% targets.

On the daily chart, we expect the price of gold to fluctuate sideways within the Symmetrical Triangle with resistance and support marked by the blue line.

On the daily chart, EUR/USD managed to rise above resistance at 1.1750 and lead the pair out of the medium-term consolidation range (1.15-1.1750).

Why is GBP/USD rising and how high it may go? What are the targets for EUR/USD, AUD/USD, and NZD/USD? Watch the video to find out!…
FBS maintains a record of your data to run this website. By pressing the “Accept” button, you agree to our Privacy policy.
Your request is accepted.
A manager will call you shortly.
Next callback request for this phone number
will be available in
If you have an urgent issue please contact us via
Live chat
Internal error. Please try again later
Don’t waste your time – keep track of how NFP affects the US dollar and profit!
