
Fundamental Analysis
The Canadian dollar (CAD) is under significant pressure due to the drop in Canada’s annual inflation rate, which fell to 1.6% in September 2024, well below the Bank of Canada's (BoC) 2% target. This price slowdown, primarily driven by the decline in gasoline and transportation costs, has fueled expectations of a 50-basis-point rate cut at the BoC’s next meeting. Additionally, oil prices, which play a key role in the CAD’s value, plummeted more than 7% last week, further impacting the Canadian dollar, which heavily depends on crude export revenues.
In contrast, the US dollar has gained ground, driven by a more resilient economy, reducing the likelihood of aggressive rate cuts by the Federal Reserve. This strengthening of the USD and the expectation of more relaxed monetary policies in Canada have pushed the USDCAD pair above the 1.3800 level. As investors anticipate the BoC rate cut, the CAD will likely weaken in the short term, especially if oil prices remain low and inflation stays below target.
Technical Analysis
USDCAD, H4
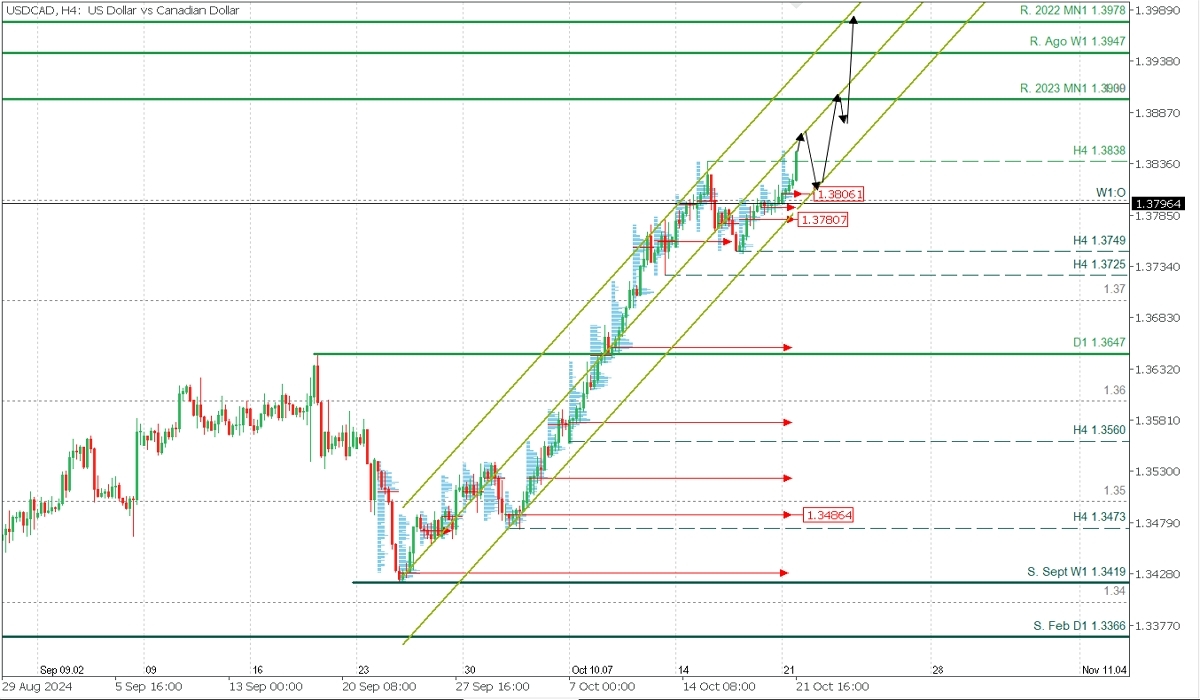
Supply Zones (Sell): 1.39
Demand Zones (Buy): 1.3806, 1.3793, and 1.3780
The pair extends its strength within the bullish linear regression channel, although it is trading near the lower band, which represents the lowest deviation from the regression line (central line) and indicates the minimum expected value within the trend. This suggests that prices have the potential to extend the bullish trend after surpassing the midline towards the 2023 resistance at 1.39 in the short term and breaking the August and 2022 resistances in the medium term.
Additionally, the bullish opening of the week responds to three key demand zones from 1.3780 (uncovered POCs*) up to the opening around 1.3806, implying a broad buying block that will prevent the price from falling below.
The last validated intraday support is at the 1.3749 level, meaning that as long as the price does not break this level in the next correction, the bullish trend will remain active.
Bearish corrective scenario:
Intraday sells below 1.3855 (after the formation and confirmation of a PAR*) with TP at 1.3825, 1.3815, and 1.3810 on extension. Use a 1% SL of your capital.
Bullish continuation scenario:
Buys above 1.3810/1.3815 (where a PAR* forms and confirms) with TP at 1.3850, 1.39, 1.3950, and 1.3980 on extension. Use a 1% SL of your capital with a low lot size to allow room for movement.
Always wait for the formation and confirmation of a *Pattern of Exhaustion/Reversal (PAR) on M5 like the ones taught here: https://t.me/spanishfbs/2258 before entering any trade in the key zones we indicated.
*Uncovered POC: POC = Point of Control: It is the level or area where the highest concentration of volume occurred. If a downward movement followed this level, it is considered a selling zone and forms a resistance area. Conversely, if an upward movement followed this level, it is considered a buying zone, usually located at lows, thus forming support zones.
@2x.png?quality=90)


