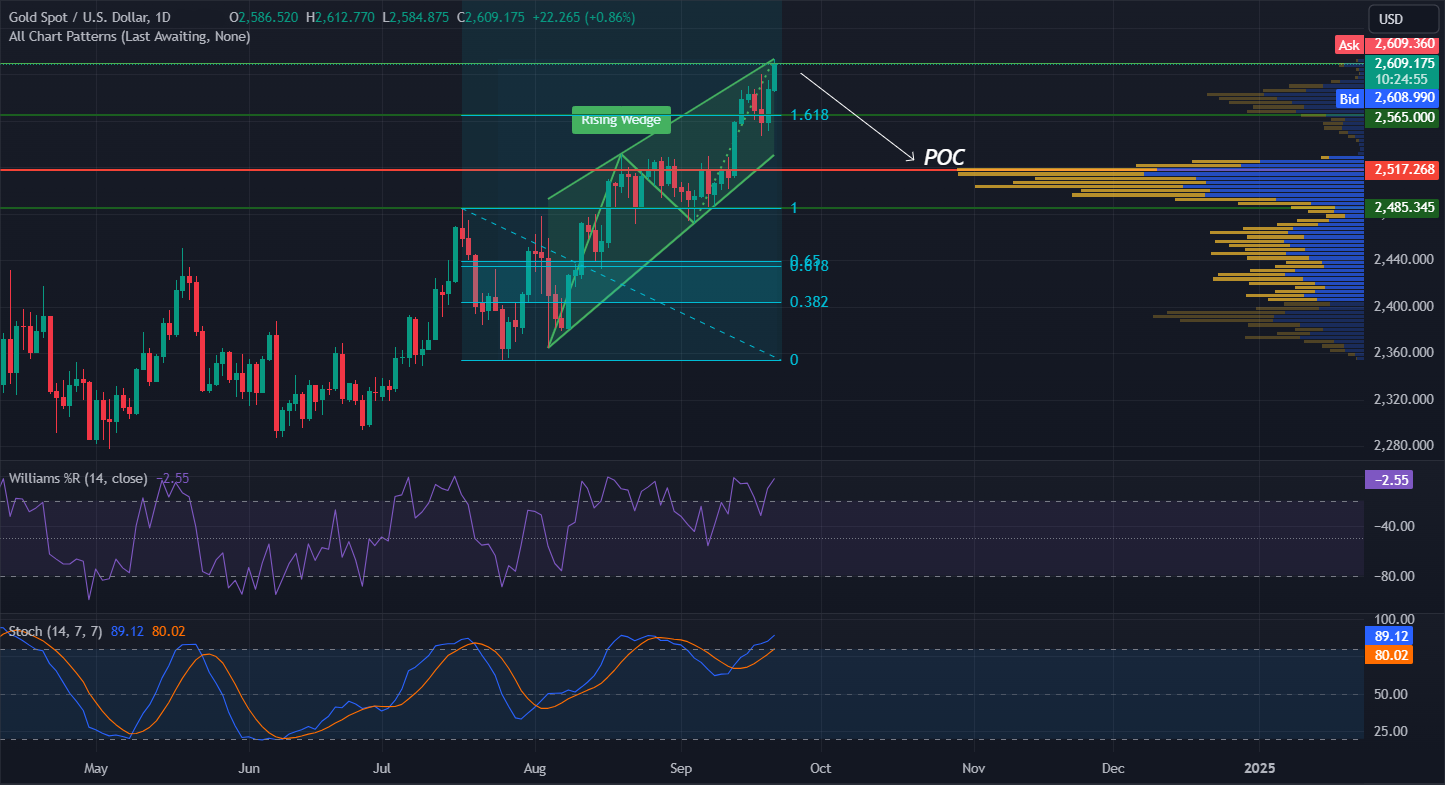
XAUUSD, 1D

In the Daily timeframe, XAUUSD moves within a rising wedge and tests its upper border.
The %R and Stochastic oscillators are in the overbought zone, confirming the potential bearish pressure for the asset with decline to the POC* zone.
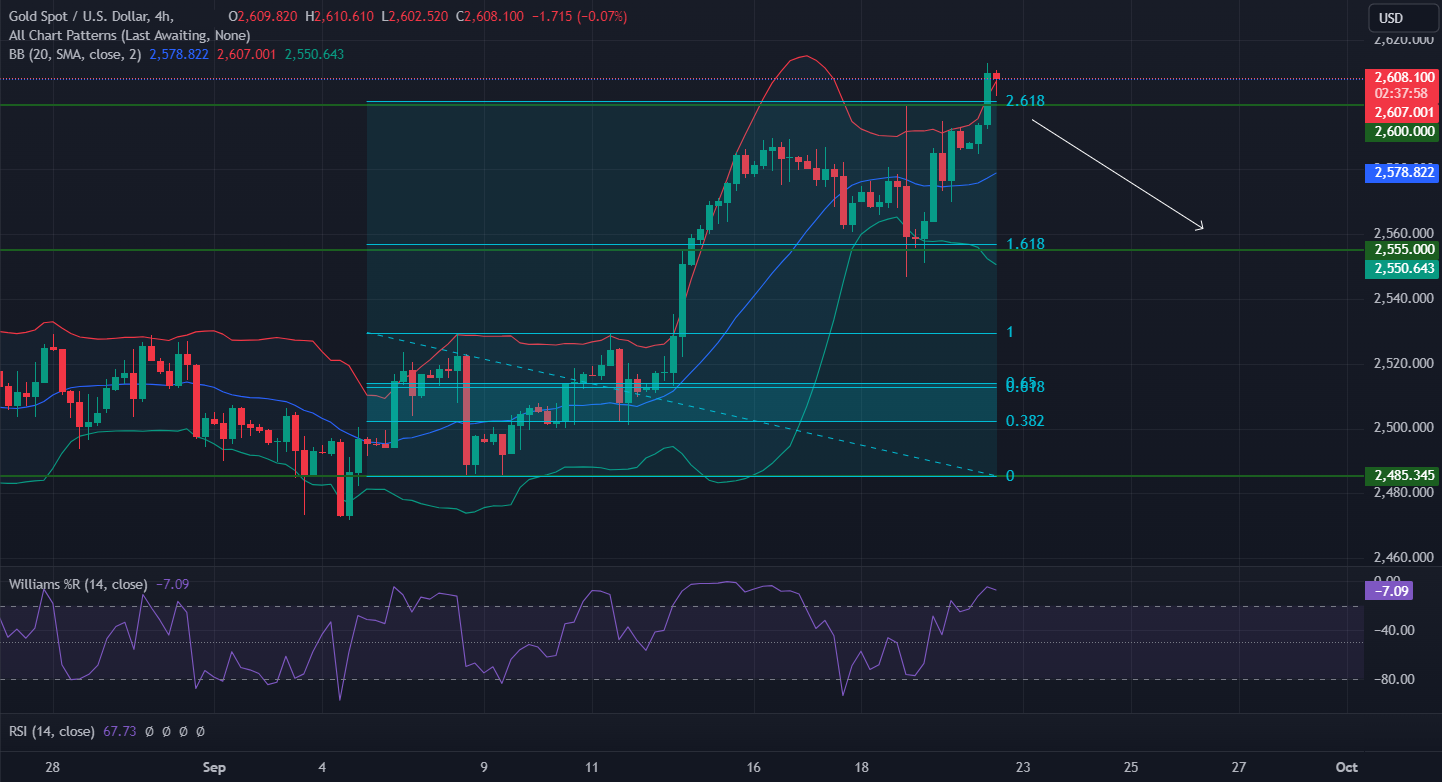
XAUUSD, H4

In the H4 timeframe, XAUUSD aims to retest the 2600 support, aligned with the 261.8 Fibonacci ratio. The price exceeded the upper Bollinger Band and subsequently retraced. The %R oscillator is in the overbought zone, giving a strong bearish sentiment with the decline toward 1.618 Fibonacci.
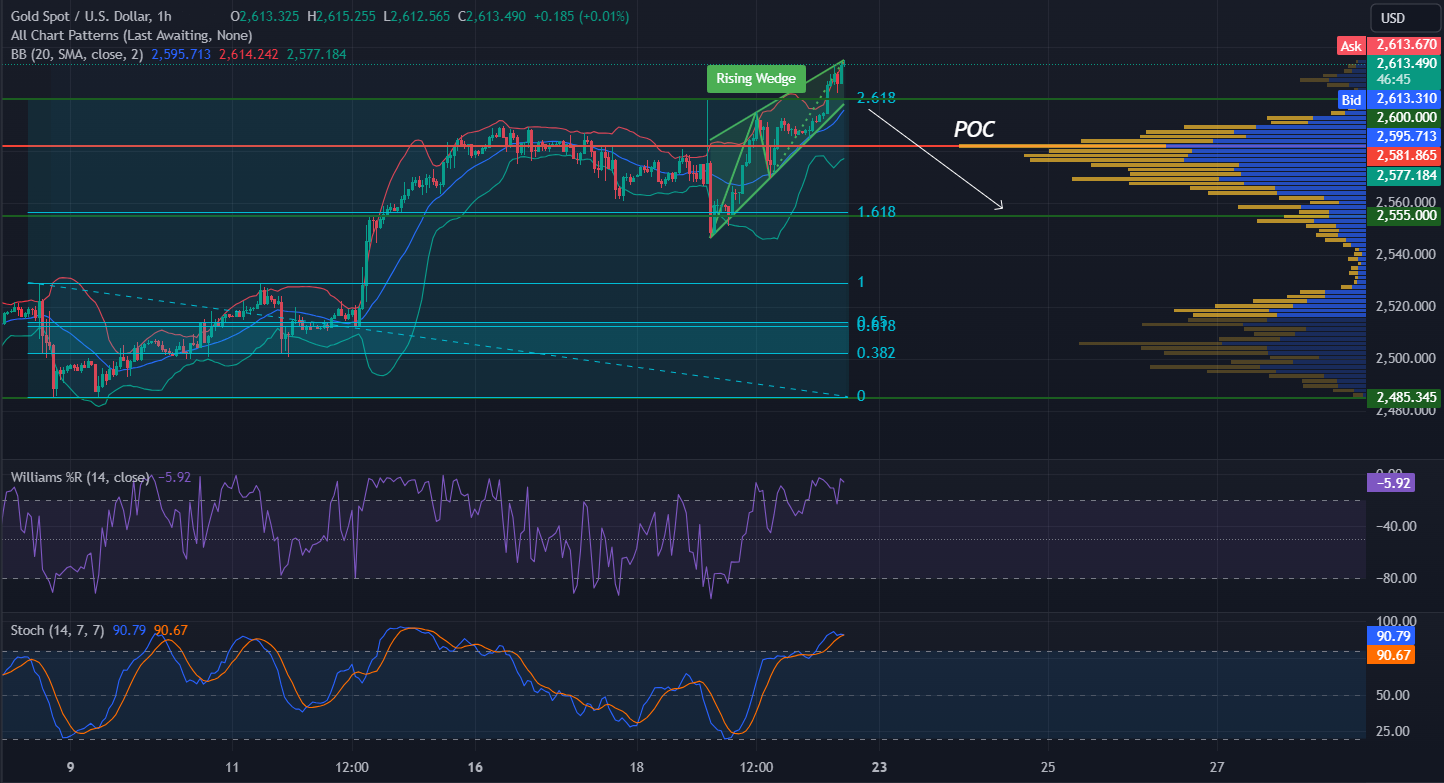
XAUUSD, H1

In the H1 timeframe, XAUUSD navigates within the rising wedge and rebounds from the upper border of the pattern.
The price also exceeded the upper Bollinger Band and subsequently retraced and the %R oscillator has crossed downwards from the overbought zone, indicating potential selling pressure.
- Trade: Sell XAUUSD on the break below the 2600 level.
- TP1: 2582 at the POC zone.
- TP2: 2555.
*POC(Point Of Control) - the price level, at which the maximum number of contracts were executed during a selected period.
