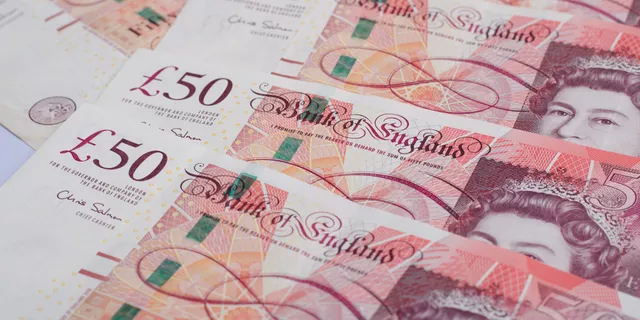
GBP/USD is currently trading within a new selling zone on both short and medium-term, which stands between 1.3915 and 1.3990 which represents its 50% and 61.8%

GBP/USD is currently trading within a new selling zone on both short and medium-term, which stands between 1.3915 and 1.3990 which represents its 50% and 61.8%

In this video, FBS analyst Ksenia discusses the top 5 technical indicators and the best ways to combine them!
In the previous article, we explained how to trade using Moving Average…
Technical indicators play a very important role: they calculate something and visualize it in the trading software thus saving a trader’s time…

Gold regained above $1900/Oz during yesterday’s trading, reaching as high as $1910 but it failed to sustain these gains during the Asian session today, leading to another leg lower back below $1900/Oz.

USD/CAD declined once again to the same support area between 1.2040 and 1.2020 which remains solid for over three weeks now.

The US Dollar Index tested the higher line of its downtrend channel on the daily chart but failed to breakout, following the disappointment of the 2nd reading of Q1 GDP.
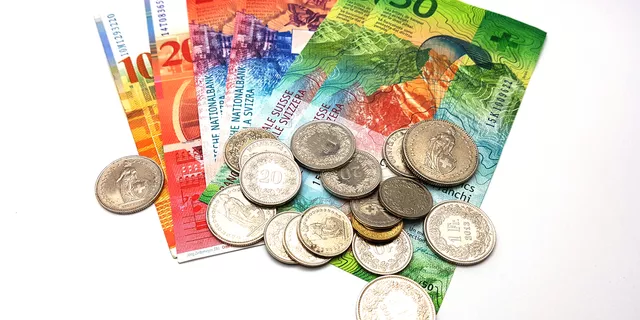
The US Dollar has been losing value against the Swiss franc for more than a month now. Let's examine where it might be going.

After reaching key psychological levels, the gold price and the S&P 500 ceded some of the gains to cool down. However, they are still following bullish trajectories.

The gold price and the S&P 500 go beyond important psychological levels sharing bullish vibes across the markets. In the meantime, WTI oil trades at local highs, too, in the hopes of an upbeat outlook to come from the OPEC meeting next week.
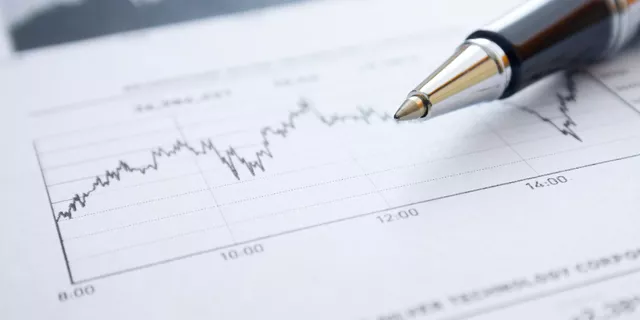
MAs are the primary technical indicator. How to use it? Let's see it in examples.

The gold price is now at the crossroad. Will it revert and fall back into the downtrend or aim at the all-time highs?
FBS maintains a record of your data to run this website. By pressing the “Accept” button, you agree to our Privacy policy.
Your request is accepted.
A manager will call you shortly.
Next callback request for this phone number
will be available in
If you have an urgent issue please contact us via
Live chat
Internal error. Please try again later
Don’t waste your time – keep track of how NFP affects the US dollar and profit!
